Your campaign’s analytics tab provides an overview of how your campaign is doing, plus some handy metrics for assessing its efficiency in recovering fees and converting visitors into supporters.
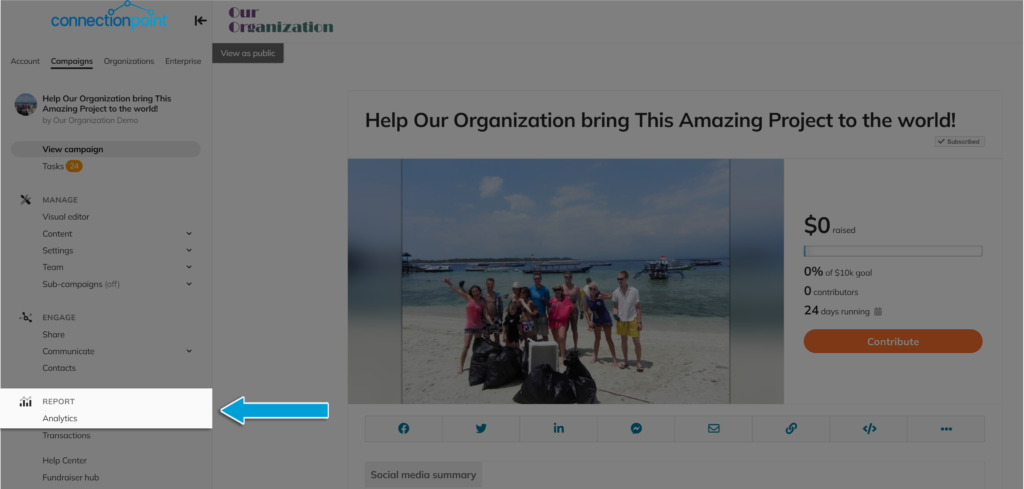
Find your campaign’s Analytics page in the navigation menu:

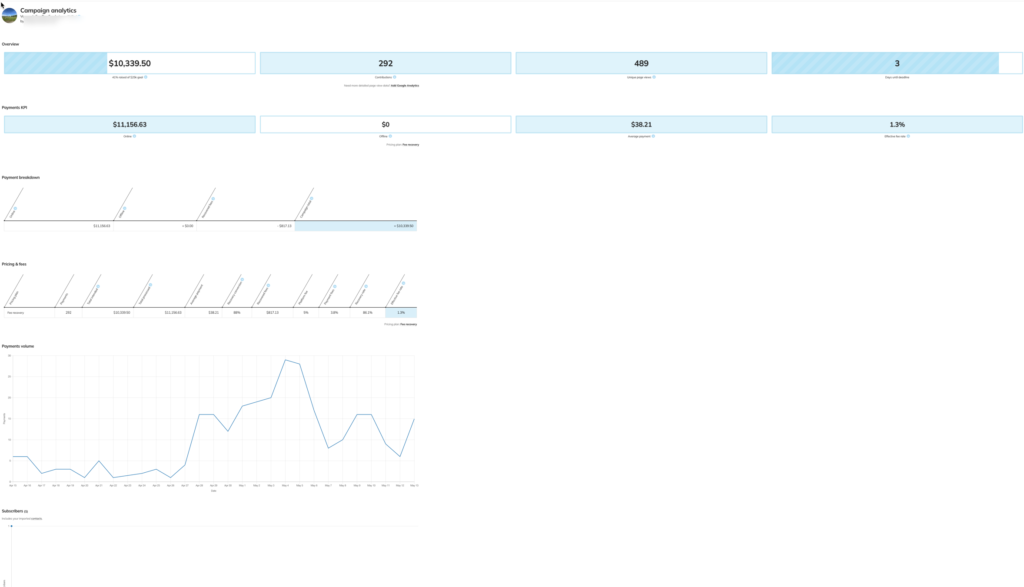
Here is an example of a campaign’s full analytics page:

NOTE: Depending on which pricing model your campaign runs in, plus which layout and campaign type you’ve chosen, you may not see every option described below.
Overview
This overview is particularly handy for finding your conversion rate. Click here for more information on what the conversion rate is and why it’s helpful.
Payments KPI
A snapshot of your contributions through the platform versus offline, so you don’t have to export transactions and math your way to the answer yourself. Also included here at the average payment and effective fee rate.
- Click here for more information on why knowing the average payment is helpful.
- Working with the ‘Fee recovery’ pricing model? You’ll want to know your effective fee rate! See why here.
Payment breakdown
Another place to see your online and offline contributions, plus more depending on certain aspects of your campaign.
- Shipping fees for reward items are not included in the ‘overall raised’ progress meter toward your goal in the main campaign and are tallied here.
- Recovered fees are the amount in fees your supporters covered for their intended contributions. This works for the ‘Fee Recovery’ pricing model only so that you can see how much in fees you have saved due to the extra care provided by your supporters!
- Excluded fees include registration fees collected by the campaign from participating fundraisers if you have chosen not to reflect these in the goal.
- The Campaign Total is the full amount of money processed and entered offline through the platform. This total will be higher than that shown on your live campaign because it will include shipping, recovered fees, and excluded fees. Your live campaign total shows the intended contributions (see below).
Pricing and fees
- Pricing model – your current pricing model or the one the campaign finished on. If you changed your pricing model during the campaign, you will not see that reflected here.
- Payments – Total number of transactions (not a monetary amount)
- Total intended – Intended contributions are the amounts your supporters went into the checkout flow with the mind to give. They do not include recovered fees but WILL include non-recovered fees in all pricing models. They also do not include shipping fees and only include registration fees if you’ve chosen to allow those fees to count toward the campaign goal.
- Total processed – The total amount of funds processed into transactions by the platform. Does not include offline contributions.
- Average payment – the sum total of contributions divided by number of contributors, represented as a dollar amount.
- Recovery ask – (Fee Recovery pricing model only) Percentage of the fee your supporters are asked to cover for you by the platform. Most will see this at 100%; however, if you’ve requested a customized recovery ask, this is reflected here.
- Recovery conversion – (Fee Recovery pricing model only) The percentage of supporters who chose to help the campaign further by covering the fees for their contribution
- Recovered fees – (Fee Recovery pricing model only) The total amount of fees covered by supporters (i.e. how much you’ve saved in fees!)
- Platform fee – How much the platform charges per transaction (0 in the ‘Optional Tipping’ pricing model). Does NOT include payment processing fees.
- Payment fees – The average payment processing fee (Stripe and/or PayPal’s fees), which is represented as a percentage of the payment amount.
- Recovery rate – (Fee Recovery pricing model only) The percentage of time supporters chose to cover fees for their transaction. In the above example, supporters chose to cover fees 89.3% of the time.
- Effective fee rate – This appears for all pricing models. However, in the ‘Optional Tip’ and ‘Flat Rate’ models, this number never changes – it is the platform fee plus your payment processing rate with Stripe and/or PayPal (averaged out, as their rates are a fixed percentage plus a small set fee. For example, in North America the average Stripe fee is 2.9% plus $0.30 per transaction). If you’re running under the ‘Fee Recovery’ model, this number may change as more support comes into your campaign. The goal is for this number to be lower than what it would have been under the other two pricing models! View this article for more information.
Payments volume
A line graph of your contributions per day through the campaign’s life. Use this to see what actions may have resulted in an uptick in contributions. This is particularly helpful with updates! See this article for more info.
Social
See how many people shared your campaign on Facebook and how many visitors to your campaign chose to subscribe.
Subscribers
A line graph of how many people subscribed to the campaign through its run.


